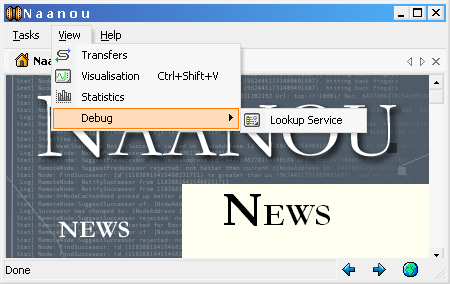

Showing the embedded web browser in the background, this main window is where the user can access all features of Naanou.

Naanou has a basic search interface. Metadata where available is shown with results.

In this shot you can see an incoming transfer, with the table columns providing
relevant information on that
transfer. In lighter text in the top right you can see aggregate statistics.

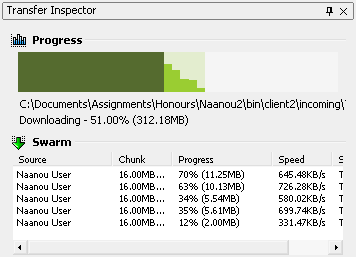
Double-clicking on a transfer (or using the contextual menu) brings up the transfer inspector that allows you to monitor the progress of a transfer. On the progress map, dark green indicates completed chunks, medium green represents chunks currently being transferred and light green is the left over parts of the resource. Here we see five swarmed sources for the one resource.

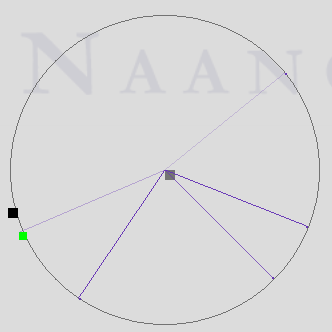
Not incredibly useful, but interesting to watch, the visualisation shows activity
of your node. Your node is represented by the
square in the middle, and the black square on the circle. Other nodes you know
about appear around the circle. When your node is
communicatinG with another, blue lines will light up and fade away. When you
node is storing keys (i.e. as a result of sharing data)
orange lines will appear.